Subject
Data Visualisation
Transform data into compelling visual stories with our Data Visualization courses. Elevate your insights and impact

Helping to Build Critical Skills in:








Why Organizations Partner with Kubicle
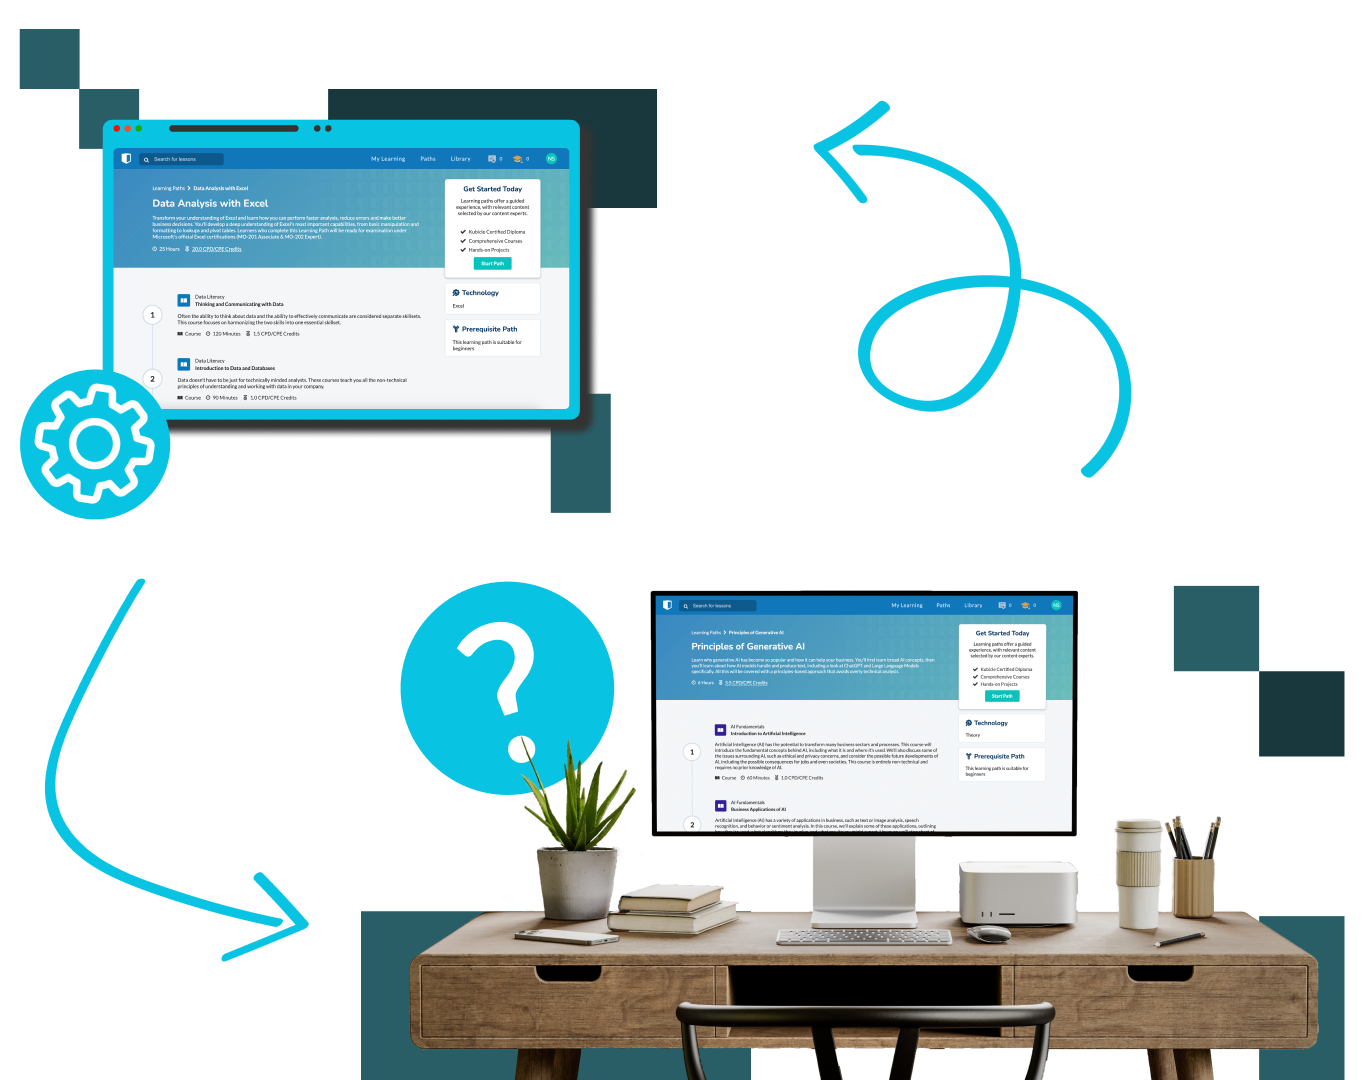
Our expansive online platform helps organizations fast-track their team’s data literacy. Offering over 1,000 lessons on vital tools, technologies, and theories, Kubicle empowers professionals from basic to advanced levels. Our engaging mix of videos, examples, and exercises ensures practical and scalable skills development.
Transform your team with Kubicle and lead in the data-driven era.
Who is this subject for?
Perfect for data analysts, marketers, and any team member eager to convey complex data through impactful visual narratives.
About this Subject
Data Visualization is crucial for interpreting complex data and making it accessible and actionable. This subject encompasses the journey from conceptual visual data thinking to the practical application of visualization skills. Participants will learn to think visually about data, apply those skills to real-world scenarios, and create visualizations that inform and persuade.
By mastering the art of transforming data into visual narratives, your team can highlight trends, patterns, and insights that drive decision-making and storytelling within your organization. Equip your team with the ability to present data in ways that engage, inform, and inspire action
Duration
Self paced
Price
Available with Enterprise License
Courses
3
Time
2.5 Hours
Learning Outcomes
Visual Analysis Skills
Develop the ability to translate complex data sets into intuitive visual analyses, making data accessible to all.
Creative Visualization Techniques
Learn creative techniques for data visualization, employing tools and software to craft engaging data stories.
Insightful Dashboard Design
Master the art of dashboard design, creating informative and interactive dashboards that provide actionable insights.
Courses in this Subject:

Real World Projects
Kubicle Projects are simulated business scenarios that test a learner’s capability to apply the concepts taught in a collection of Kubicle courses. Before practicing new found skills in the real-world, learners can do so in the safety of a sandbox environment.
Request Our Full Course Catalog

Learning Certificates
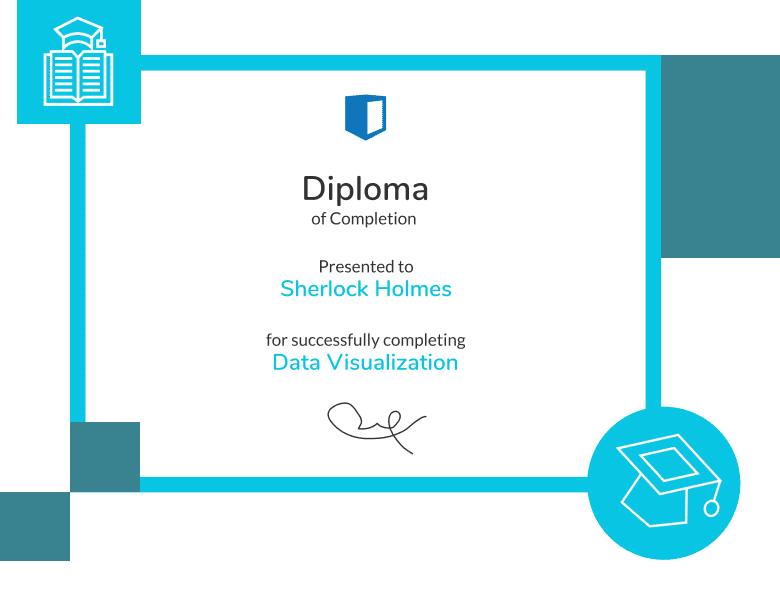
Each time you complete a course exam, you earn a certificate that demonstrates your proficiency in that subject matter. Every Kubicle certificate is recognized by the CPD Standards Office, CPE and NASBA (the National Association of State Boards of Accountancy).
When your teams earn internationally-recognized certificates, they increase their confidence. And when they increase their ability, speed and accuracy, you increase your firms competitiveness.
Our Courses are
recognised by:


Testimonials

“Kubicle solved key training delivery and tracking needs for Excel, Financial Modelling & Data Analysis”
Ben Thuriaux-Aleman
Partner at Arthur D Little

“E-learning can be a mixed bag, but I’ve been impressed by Kubicle’s focus on demystifying complex material.”
Agata Bak-Geerinck
Senior Consultant at Deloitte…..

“If I didn’t have Kubicle, I would have spent 2 to 3 times more on data literacy challenges like financial modelling”
Seyed Ali Mirmoezi
Corporate Strategy Manager at Fugro

