The formula for standard deviation is a common statistical function that many Excel users will come across. The standard deviation numerically measures the spread, or deviation, of numerical data from the mean. In Excel, there are actually four standard deviation functions available, so it can be a bit confusing working out which one you need to use. In this post, we will look at how to use the standard deviation formulas in Excel.
What is standard deviation?
I’m primarily here to discuss Excel, not to give a statistics lecture, but it makes sense to review the concept of the standard deviation. Once you know exactly what standard deviation you are looking to compute, the Excel bit is actually fairly easy.
Standard deviation is a way to measure how the spread out certain values are within a group of obvservations, relative to the average value for all observations. It is a measure of dispersion. For example, if we observe a group of widgets with the prices of $1, $4 and $7, then the avergage price is $4. If we observe a second group of widgets with the prices $4, $4 and $4, then the average price is also $4. However, the first group of widgets has a much higher dispersion (standard deviation) than the second. In fact, the second group has a standard deviation of 0.
To compute the standard deviation of a group, we first need to understand the concept of variance.
Variance
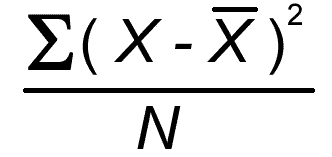
To calculate variance we first take the distance between each observation and the mean of all observations. When computing the standard deviation, we are not interested in the sign (+ or -) of this distance, so we square it, to ensure it is always positive. We sum this distance for each data point, and then divide by the total number of data points. The result of this calculation is known as the variance.
In the case of three widgets with the prices $1, $4 and $7, we perform the first part of the calculation as follows:
(1-4)² + (4-4)² + (7-4)² = (3)² + (3)² = 18
This figure (18) is then divided by the total number of data points (3), giving us the variance 6.
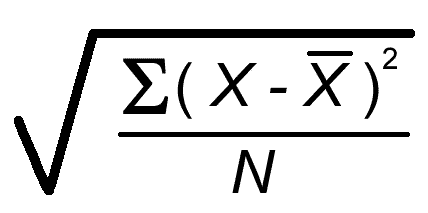
To compute the standard deviation, we simply take the square root of the variance. The main advantage of doing this is that the standard deviation is expressed in the same units as the original data, which makes it much easier to interpret. In the case of our example, the standard deviation is 2.45.
Standard Deviation
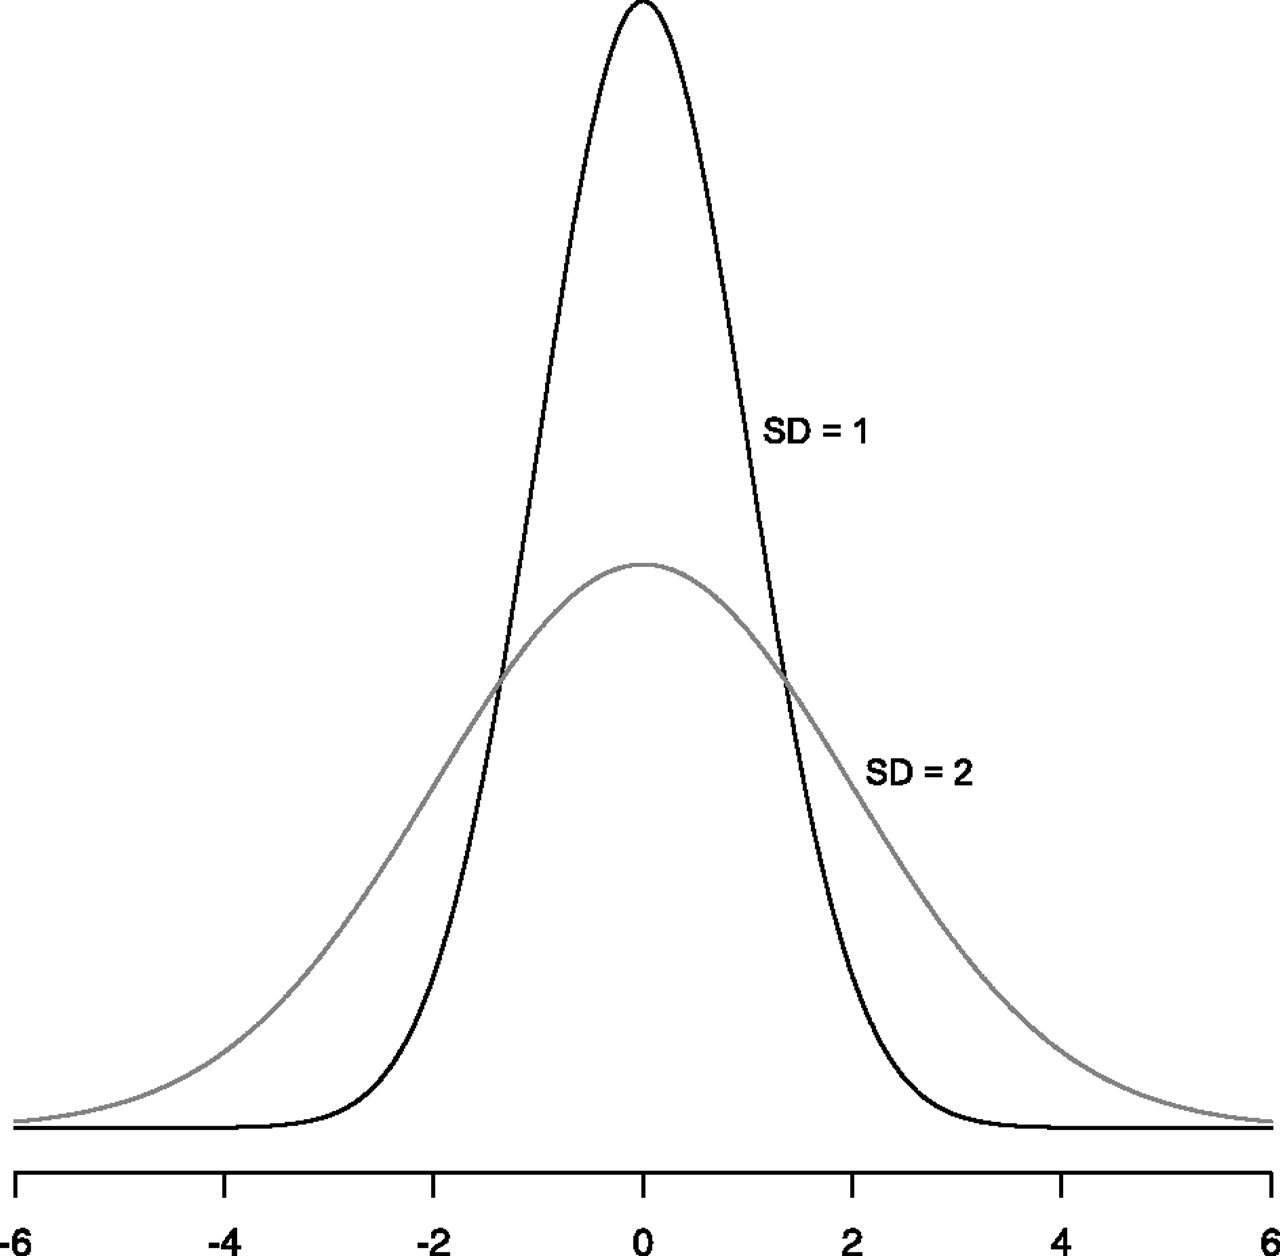
Generally, a small standard deviation indicates a dataset that has a low spread of values, while a higher standard deviation indicates a wider spread of data. Used in conjunction with the mean, a standard deviation can tell you a lot about the structure of your data.
Measuring Dispersion with Standard Deviation
Sample or Population
The discussion above assumes you are calculating a population standard deviation. A population standard deviation assumes that the dataset represents the entire population of interest, while a sample standard deviation assumes the data represents a subset of a larger population.
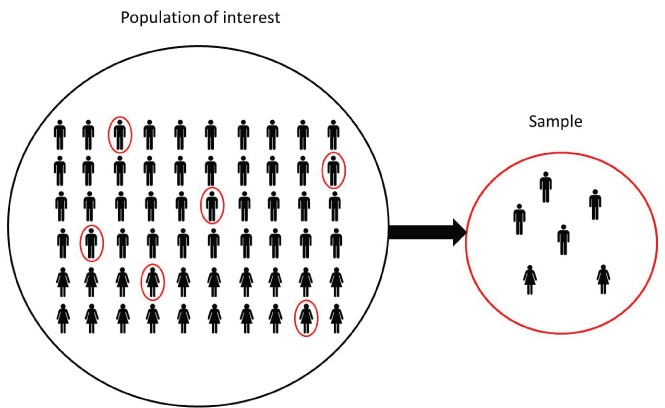
For example, if you were analyzing census data or a dataset of all the people in your company, a population standard deviation would make sense, as your dataset includes all the people of interest.
If you were analyzing a dataset of people in one office of your company, and wanted to generalize your conclusions to the whole company, you would use a sample standard deviation.
The calculation of a sample standard deviation differs only very slightly from the population standard deviation, so the results will often look similar numerically. However, it is worth distinguishing between the two, as Excel requires you to know which standard deviation you are computing.
Standard Deviation in Excel
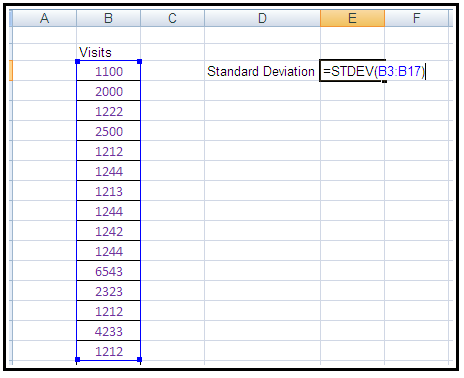
Once you know what standard deviation you are calculating, the Excel calculation is not difficult. There are four standard deviation functions in Excel. The two most common are STDEV.S, which computes the sample standard deviation, and STDEV.P, which computes the population standard deviation. These take a range of numerical data as their argument and compute the standard deviation in the way we saw above. You can pass more than one data range to the function, and Excel will calculate the standard deviation in exactly the same manner as above.
There are two other standard deviation functions, STDEV.A and STDEV.PA. These compute standard deviations in a similar way, but they can accommodate non-numeric fields such as text and TRUE/FALSE. Text fields, or fields that are False, will be given the value zero, while fields that are True will be given the value 1. Stdeva calculates a standard deviation and stdevpa calculates a population standard deviation.
There are some instances where this might be useful. For example, if your data had some rows that were blank or null, it might make sense to treat them as zeros. Of course, a better solution would be to find out why the data is missing and obtain a value for it, but in the real world, that probably won’t be possible. Generally if you have non-numeric data and want to use these formulas, you should be clear that you know how it will be treated and be sure that treatment makes sense in the context of your dataset.
Conclusion
Once you understand what the standard deviation is, calculating it in Excel is pretty straightforward. You need to consider two questions:
- Is your data a population or a sample?
- Is your data entirely numeric or not?
Once you can answer those two questions, using the standard deviation formula follows very easily!
This guide was comstructed with the help of a lesson from Kubicle’s online training for Excel. If you’d like to learn more, check out our hassle-free 7 day trial today.

Featured image by rawpixel.com


